
Charts & Analytics
Overview
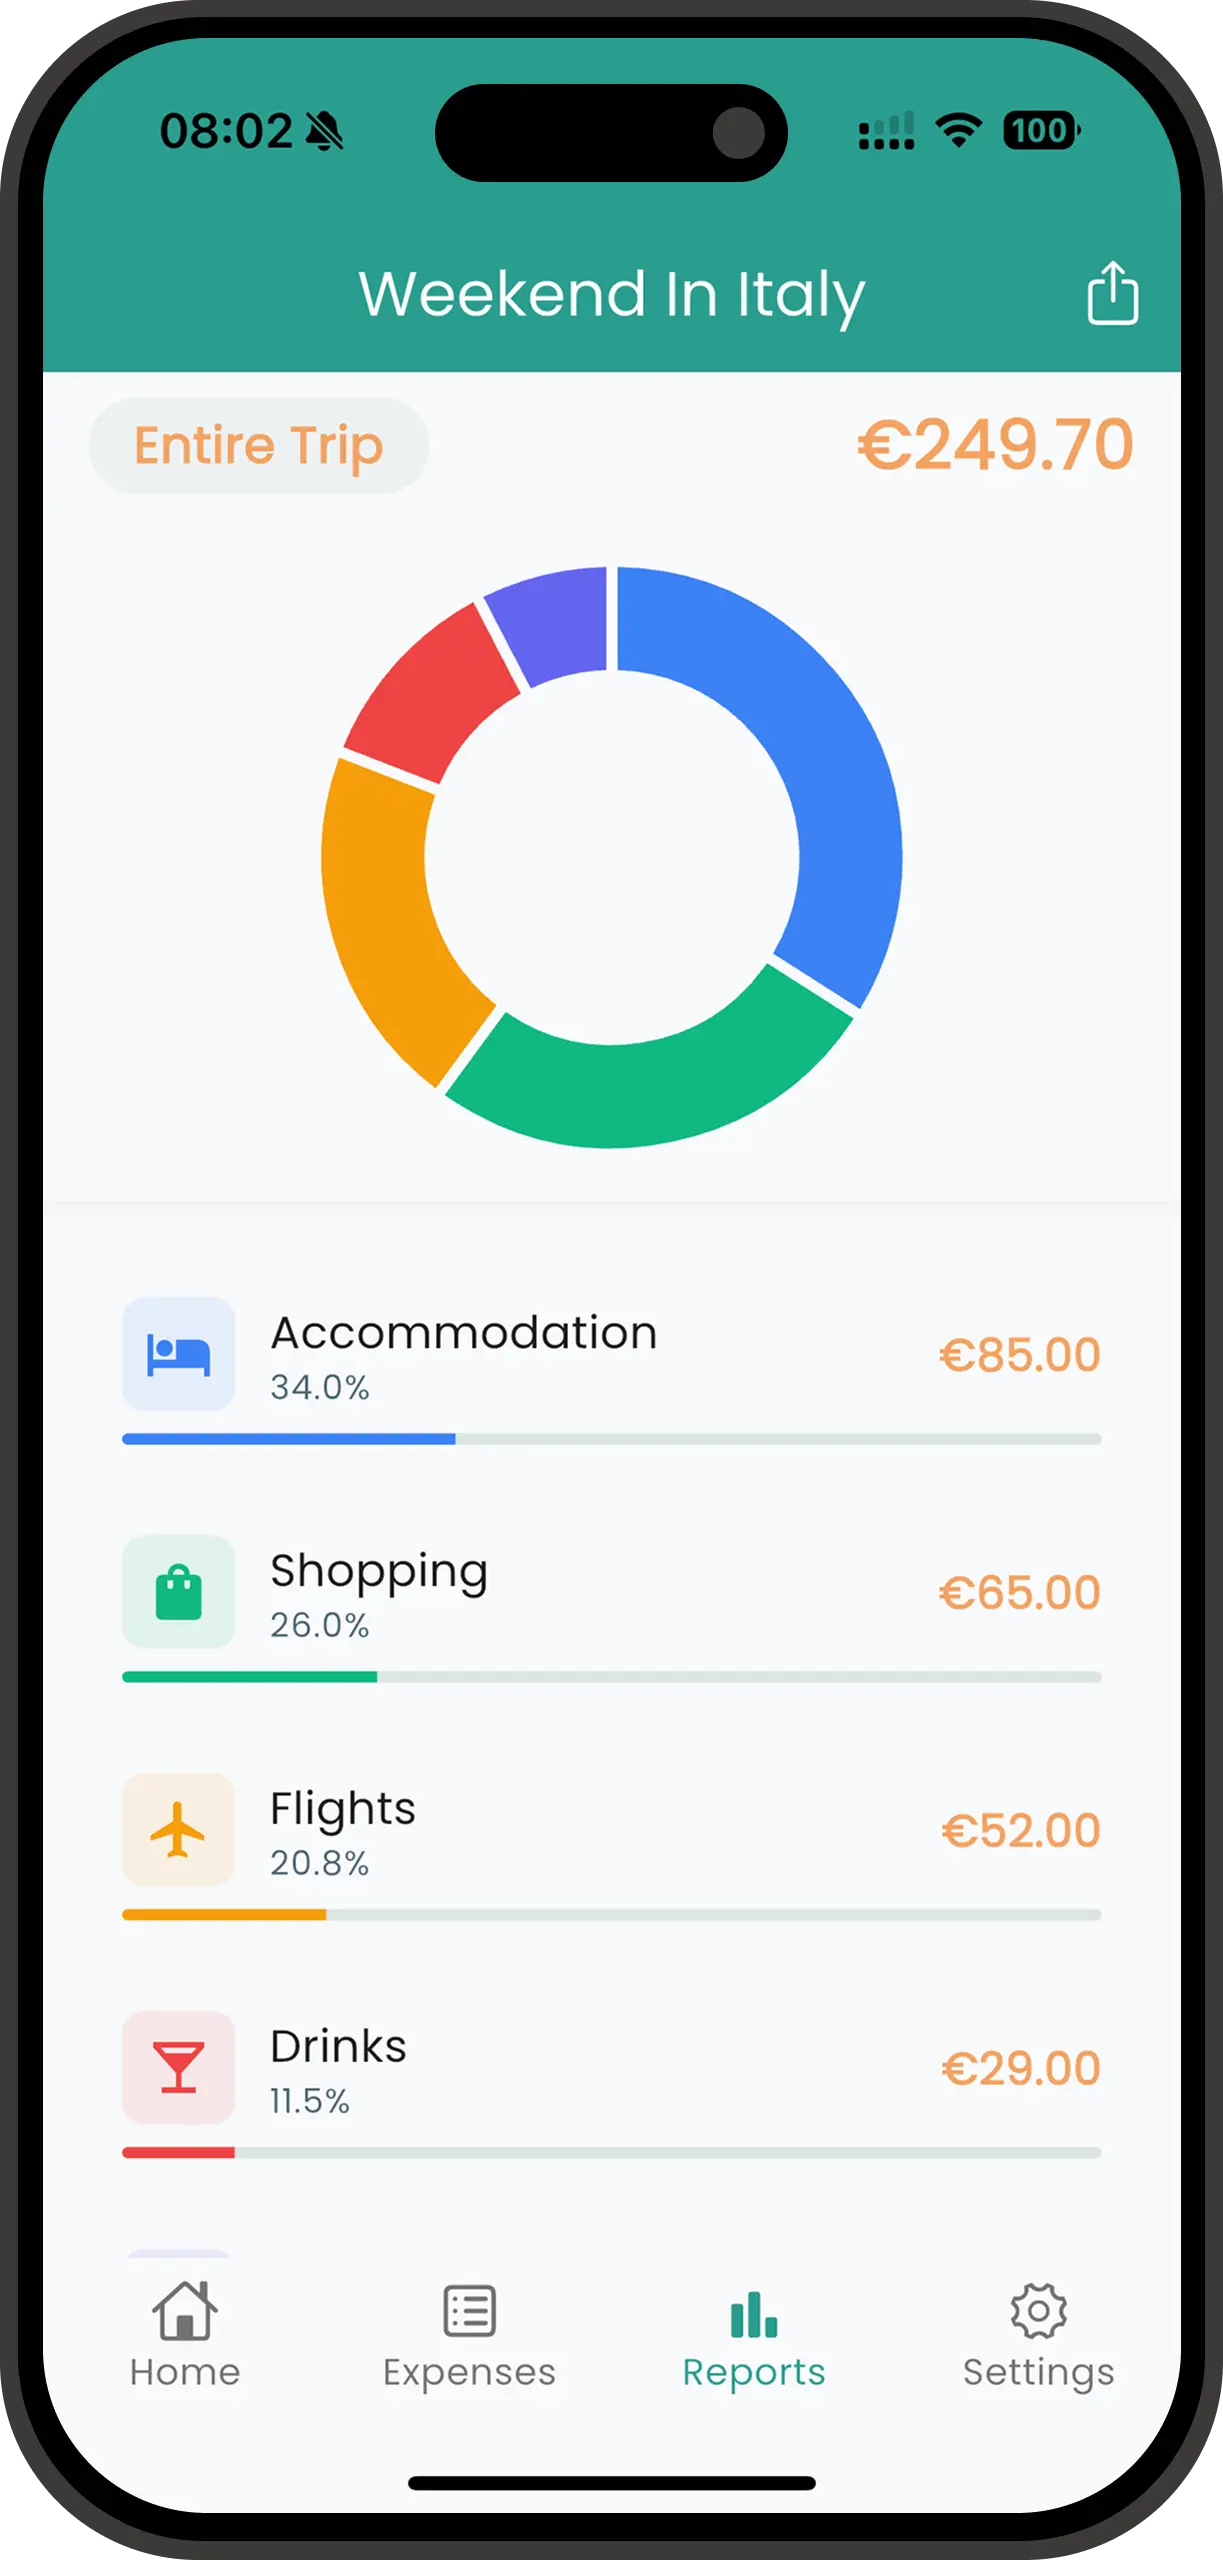
The Reports screen turns your raw expenses into visual breakdowns. See where your money goes by category, tag, or trip member. Pick any date range, apply filters, and the charts update instantly.
Basic charts are available on the free plan. No subscription required.
How to Use It
Report Tabs
The reports screen has three tabs. All three share the same date range and filters.
Categories Report
Pie and bar chart showing spending by the 14 travel categories. Each category shows its percentage of total spending and the exact amount.
Tags Report
Spending grouped by your custom tags. Since a single expense can have multiple tags, percentages may add up to more than 100%. This is expected.
Members Report
Only available in shared trips. Shows how much each member spent during the selected period. Useful for splitting costs or tracking individual contributions.
Changing the Date Range
Tap the period label at the top of the Reports screen to choose a period: the entire trip, the last 7 days, the last 30 days, or a custom date range. All three report tabs update together. When a shorter period is active, tap the × on the label to go back to the entire trip.
Filtering
Tap the filter button to open the unified filter panel. You can filter by:
- Categories (select one or more of the 14 travel categories)
- Tags (select one or more custom tags)
- Members (in shared trips only)
- Special filters: tagged-only or untagged-only expenses
The filter button shows a badge with the number of active filters. Tap Clear All inside the filter panel to reset everything.
Tips
Tags Can Overlap
One receipt tagged "Business" and "Travel" counts toward both tags. The tags report reflects this, so the sum of all tag amounts may exceed the total spending for the period.
Filters Apply Everywhere
When you set a filter, it applies to all three report tabs and to any PDF or CSV export you generate while the filter is active.
Custom Date Ranges
Need a report for one leg of a journey, a single week, or a billing cycle? Use the custom date range option to set exact start and end dates.
Free to Use
Charts and analytics are available on the free plan. You do not need a subscription to view spending breakdowns by category, use filters, or change date ranges. The tags report stays empty until you have tags, and the members report until you share a trip — both of those are paid features.