Turn Data Into Understanding
You finish a two-week vacation and know you spent $3,200 total. But what does that number actually tell you? How much went to hotels versus food? Did you spend more in the first week or second? Were activities expensive or reasonable? Without visual breakdowns and trends, your expense data is just a pile of numbers — accurate but meaningless.
Most expense trackers stop at totals. They give you a number and call it done. But smart travelers need more: they need to understand where money goes, identify spending patterns, spot opportunities to save, and make informed decisions about future trips. Raw data doesn't provide insights; visualization and analysis do.
Spentrip's travel insights transform your expense data into beautiful, actionable intelligence. See exactly where every dollar went with interactive pie charts that break down spending by category. Filter by time period to compare different phases of your trip. Discover that dining accounted for 40% of spending, or that your first week cost significantly more than your second. These insights help you become a smarter traveler, making better budget decisions trip after trip.
How Travel Insights Work
Spentrip analyzes your expense data continuously, generating insights and visualizations automatically. Here's what happens behind the scenes:
Continuous Data Aggregation
As you log expenses, Spentrip aggregates data by category, date, trip, and other dimensions. This happens instantly and automatically — you don't trigger reports or wait for processing. The insights are always current and accurate.
Visual Chart Generation
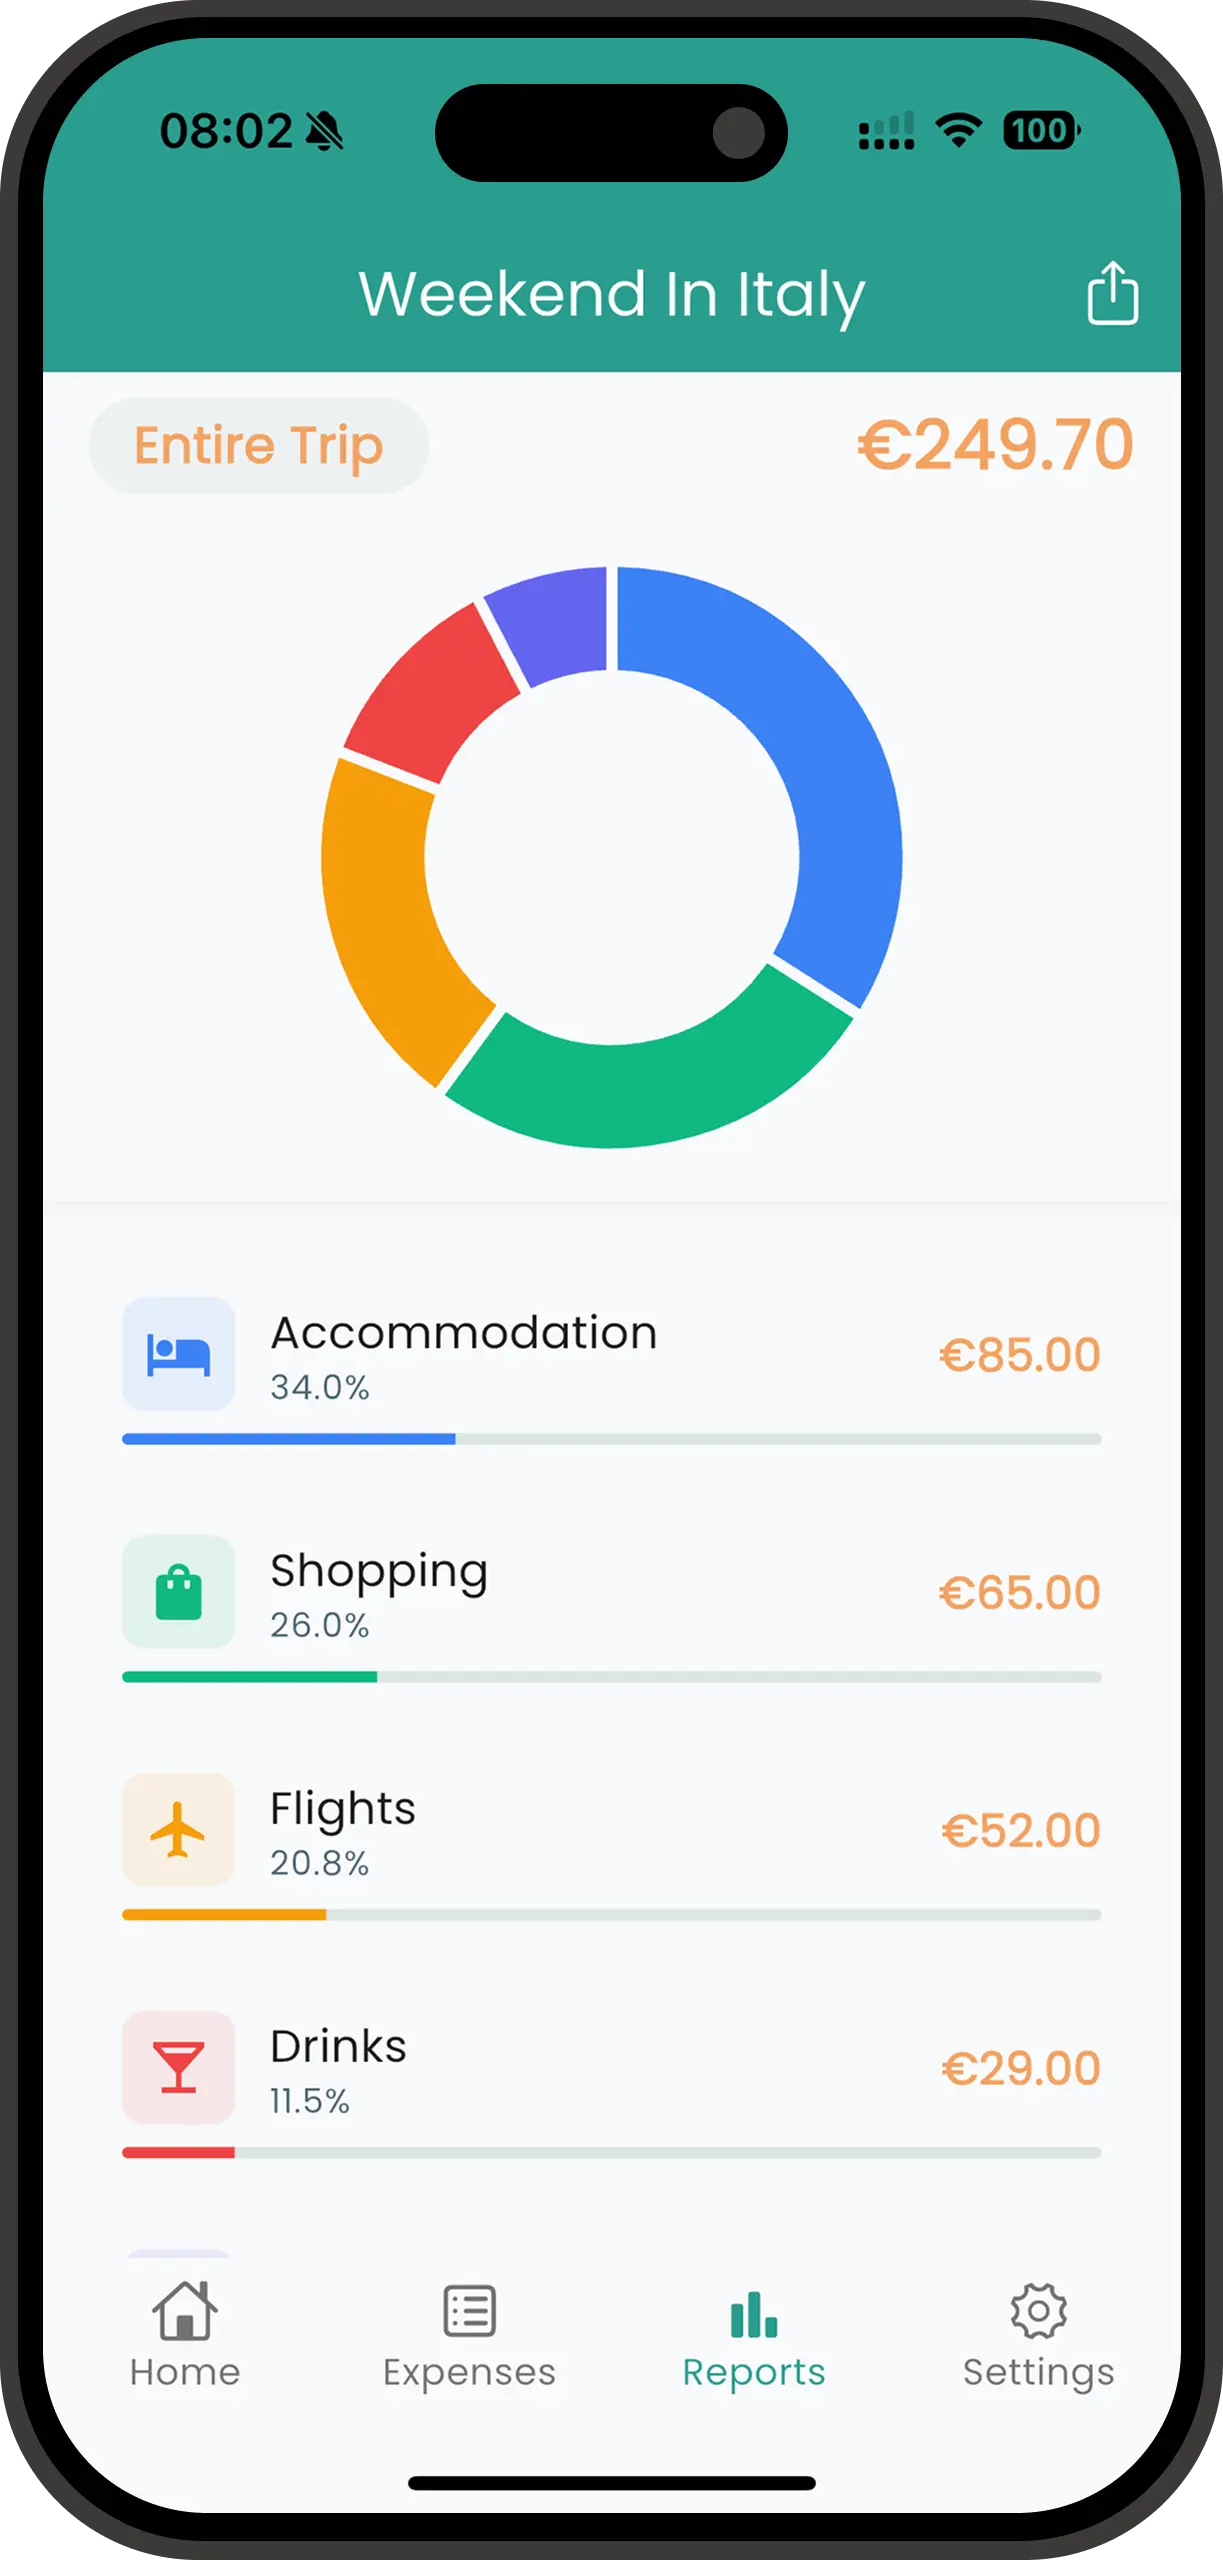
The app creates a beautiful, interactive pie chart from your data showing category breakdowns at a glance. Tap any slice to drill down into details, and use the date filter to analyze specific time periods within your trip.
Pattern Detection
Spentrip identifies patterns in your spending by comparing different time periods and categories. Filter the chart to see how spending changed week-to-week, or compare the first half of your trip to the second half to spot trends.
Budget Progress Tracking
If you've set a trip budget, Spentrip tracks progress in real-time. See how much you've spent, how much remains, your daily average, and projected final total. Get alerts when you're approaching budget limits to avoid overspending.
All insights update live as you add expenses. There's no "generate report" button to press or complex filters to configure. Open the Insights tab and see your spending visualized beautifully, providing immediate answers to "where is my money going?"
Why Visual Insights Matter
Instantly Understand Spending
A pie chart showing 45% Food, 30% Accommodation, 15% Activities, 10% Transportation tells you more in 3 seconds than scanning 100 line items ever could. Visual insights make complex data comprehensible at a glance.
Discover Hidden Patterns
Filter the chart by different time periods to reveal insights you'd never notice in raw data. Compare your first week to your second week, or analyze weekend versus weekday spending. Recognizing these patterns helps you adjust behavior and save money on future journeys.
Stay On Budget
Real-time budget tracking shows exactly how you're pacing. If you're halfway through your trip but have spent 70% of your budget, you know you need to scale back spending. Avoid the shock of budget overruns with proactive monitoring.
Plan Smarter Future Trips
Historical insights inform future planning. If your last beach vacation cost $100/day for food, budget accordingly next time. If European cities consistently run 50% over budget, adjust your planning. Learn from past trips to become a more informed, strategic traveler.
Insights That Change Travel Behavior
Discovering the Dining Problem
Claire and Ben always wonder why their vacations cost more than expected. After their Paris trip, they review Spentrip's category breakdown and are shocked: dining represented 48% of total spending — $1,920 of their $4,000 budget. They were eating at restaurants three times daily without realizing the cumulative cost. The visual pie chart makes the impact undeniable. On their next trip to Barcelona, they adjust: breakfast from grocery stores, packed lunches for sightseeing days, and nice dinners out. Their Barcelona trip costs $2,800 for the same duration, saving $1,200 by cutting dining to 28% of budget. The insights drove behavioral change that dramatically improved their travel budgets.
Weekend Spending Spikes
Derek tracks his month-long digital nomad stint in Thailand. Using the date filter on the pie chart, he compares weekday spending to weekend spending and notices a stark difference — his spending nearly doubles on Saturdays and Sundays. He realizes he's treating weekends as "vacation mode" even though he's technically working. This pattern costs him an extra $800 over the month. The next month in Vietnam, he consciously moderates weekend spending, treating them more like regular days with occasional splurges. His average daily cost drops from $65 to $48, extending his travel budget by weeks. Without the ability to filter and compare time periods, he never would have spotted this unconscious pattern.
Budget Success Through Monitoring
The Rodriguez family sets a strict $3,000 budget for their 10-day Disney World vacation. They check Spentrip's budget tracker daily. On day 5, they've spent $1,800 — 60% of budget with 50% of trip remaining. The projection shows they're headed for $3,600 total. They course-correct immediately: skip the expensive character breakfast ($180), choose counter-service meals instead of sit-down restaurants, and reduce souvenir shopping. By day 10, they finish at $2,950 — under budget and stress-free. The real-time budget tracking and projection gave them actionable data to make mid-trip corrections, preventing the budget disaster they experienced on previous vacations.
Frequently Asked Questions
What types of charts and reports does Spentrip provide?
Spentrip includes interactive pie charts showing category breakdowns, daily spending summaries, budget vs. actual comparisons, and per-trip totals. The pie chart can be filtered by custom date ranges to analyze specific periods of your trip.
Can I compare spending across multiple trips?
Yes! View side-by-side comparisons of different trips to see which destinations were more expensive, how your spending patterns changed, or where you stayed under/over budget. This is perfect for planning future trips based on historical data.
How do budget tracking and alerts work?
Set a budget for each trip, and Spentrip tracks your progress in real-time. You'll see how much you've spent, how much remains, and your daily average. The app alerts you when you're approaching or exceeding your budget, helping you stay on track.
Can I export charts and insights?
Absolutely. Export visual reports as PDF files with embedded charts, or download raw data as CSV/Excel for custom analysis. Perfect for sharing trip summaries with travel companions or creating budget presentations.
Join our growing community of travelers who enjoy their adventures without expense tracking headaches
Start your journey to stress-free travel expense tracking today